Real estate statistics
House prices edge up, stock for sale still elevated
16 Sept 2025

Our take on the latest Real estate statistics (Tue 16 Sept 2025)


House prices up 0.2% from July (sa)
House sales down 4.5% from July (sa)
Stock of properties for sale up 1.5% from July (sa)
The key numbers...
- House prices edged up 0.2% in August from July (seasonally adjusted), breaking the three-month stretch of monthly falls. House prices recorded their largest annual increase (+0.4%) since June 2024.
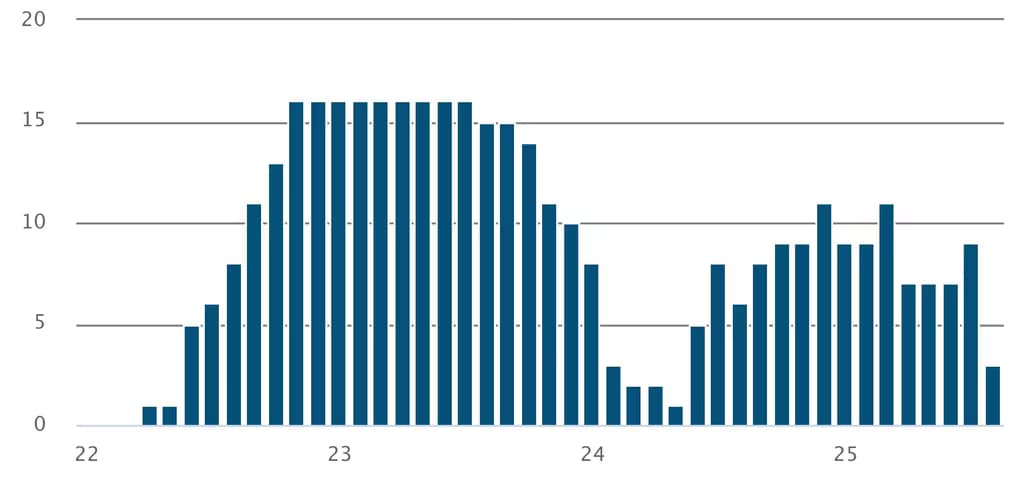
- House prices were lower than a year ago in just three of New Zealand’s 16 regions, the fewest regions to see an annual decline since May 2024. Declines occurred in Northland (-2.1%), Wellington (-1.1%), and Manawatū-Whanganui (-0.6%). The regions that saw the largest increases were Southland (+4.4%), Hawke’s Bay (+2.1%), and Canterbury (+1.9%).
- House sales fell 4.5% in August from July, declining for the fourth consecutive month (seasonally adjusted). House sales were lower than a year ago (-3.7%) for just the second time since April 2023.
- The stock of properties available for sale rose 1.5% from July, increasing for the first time since May. The number of new listings rose 4.2% from July, with the August total the highest since January. The rise in new listings pushed the number of properties available for sale over 33,000, the highest total since October 2024 (all figures seasonally adjusted).
Few regions with annual house price declines
Number of regions with negative annual house price growth
...and our reaction
- House prices have recorded annual rises in each of the last four months, but prior to August, the rises have largely been a function of month-on-month falls a year ago. The 0.4% annual rise in August was driven by a seasonally adjusted month-on-month rise, showing some more positive signs for house price growth over the remainder of 2025.
- Despite the rise in prices, sales are still struggling to make a dent in the surplus of properties available for sale, with properties taking considerable time to sell. The median length of time to sell remains elevated at 47 days (seasonally adjusted), well above the long-term average 39 days.
- There are very early signs emerging that the labour market is beginning to turn, with job ads lifting for two consecutive months for the first time in more than three years (based on Infometrics seasonal adjustment of MBIE data). A recovering labour market should help to give potential buyers more confidence in their ability to service a mortgage. With further interest rate cuts before the end of this year, these trends could result in rising sales next year, and a reduction in the surplus of properties available for sale.
Latest updates
Premium

Real estate statistics
House sales and prices still falling
Thu 13 Aug 2026
Monthly
10%pa House sales in July 20260.4%pa House prices from a year earlier 9.3%pa Stock of homes for sale in July 2026
Premium
Real estate statistics
Conflict continues to drag on housing market in June
Wed 15 Jul 2026
Monthly
8.8% House sales between Feb and Jun 2026 (seas adj)0.8% House prices since February (seas adj)4.8% Stock of homes for sale since February (seas adj)Real estate statistics
House buyers dry up ahead of interest rate rises
Mon 15 Jun 2026
Monthly
13%pa House sales in May 20260.6%pa House prices from May 2025 Stock of homes for sale at an 11-year high
Real estate statistics
House prices and sales fall
Thu 14 May 2026
Monthly
7.9%pa House sales in Apr 20260.5% House prices from Mar 2026 (sa)1.2% Stock of homes for sale since Feb 2026 (sa)