
Our take on the latest Real estate statistics (Wed 22 Jan 2025)


House sales down 12% from November (sa)
House prices unchanged from November (sa)
Stock of properties for sale down 1.6% from November (sa)
The key numbers...
- House sales in December fell 12% from November (based on Infometrics seasonal adjustment), but remain higher than a year ago, up 1.8% from December 2023.
- House prices were unchanged in December from November (seasonally adjusted). House prices have been lower than a year ago for five consecutive months, with the annual decline ending the year at 1.1%pa.
- Month-to-month price changes remain mixed across the regions, with the largest falls in Marlborough (-1.9%) and Tasman (-1.9%). Nelson (1.0%) and Otago (0.6%) led the monthly price rises (all figures seasonally adjusted). On an annual basis, Wellington saw the largest decline (-4.9%pa), followed by Marlborough (-3.0%pa).
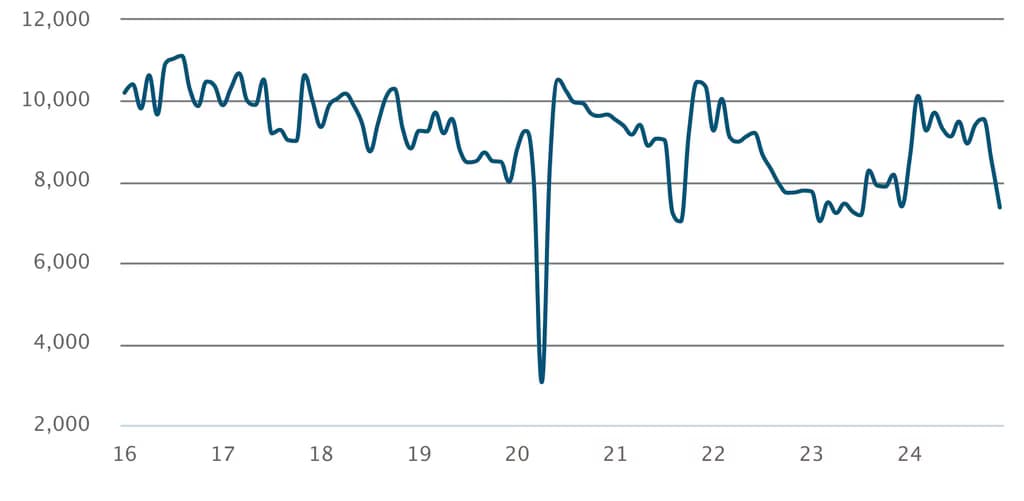
- The stock of properties available for sale fell 1.6% in December from November, declining for the second consecutive month. New listing numbers fell 13% from November, the second consecutive double-digit decline. New listing numbers were lower than a year ago for the first time in a year, down 1.3%pa.
Slowing new listings narrow surplus stock for sale
New NZ based listings on realestate.co.nz, seasonally adjusted
...and our reaction
- Properties available for sale on the market appear to have peaked, with two consecutive monthly declines. Despite a large 13% month-on-month fall in sales, the surplus of stock available for sale was able to narrow. The number of new listings has slowed considerably to its lowest month (7,400) since July 2023 (all figures seasonally adjusted). There remains a reasonable surplus of properties for sale on the market, with just under 30,000 available.
- The average length of time on the market rose 4.9% from November, increasing by three days to 49 days (all figures seasonally adjusted). The series remains volatile month-to-month, but with new listing numbers appearing to have hit a ceiling, there should be some moderation in the average length of time on the market as the market works through the current surplus of properties available for sale.
- With households rolling onto lower mortgage rates over the next six months, there should be less financial pressure on households to list. As a result, we expect to see listing numbers continue their downward trend. At a household level, there will be some shift of concern from mortgage rates to job security as unemployment rises over the first half of 2025, potentially offsetting some of the mortgage rate relief.
- Potential buyers might be waiting on the sidelines for further reductions to mortgages rates following the likely cut to the official cash rate by the Reserve Bank on 19 February. There remains some uncertainty over the size of the cut, with potential tradable inflation pressure following recent movements in the exchange rate and oil prices, as well as changes to the international trade environment following US President Trump’s inauguration this week.
Latest updates
Premium

Real estate statistics
House sales and prices still falling
Thu 13 Aug 2026
Monthly
10%pa House sales in July 20260.4%pa House prices from a year earlier 9.3%pa Stock of homes for sale in July 2026
Premium
Real estate statistics
Conflict continues to drag on housing market in June
Wed 15 Jul 2026
Monthly
8.8% House sales between Feb and Jun 2026 (seas adj)0.8% House prices since February (seas adj)4.8% Stock of homes for sale since February (seas adj)Real estate statistics
House buyers dry up ahead of interest rate rises
Mon 15 Jun 2026
Monthly
13%pa House sales in May 20260.6%pa House prices from May 2025 Stock of homes for sale at an 11-year high
Real estate statistics
House prices and sales fall
Thu 14 May 2026
Monthly
7.9%pa House sales in Apr 20260.5% House prices from Mar 2026 (sa) 1.2% Stock of homes for sale since Feb 2026 (sa)