
Our take on the latest Real estate statistics (Tue 15 Nov 2022)


Auckland house prices edge up 0.3% (seasonally adjusted) in October
House sales fall 9.6% (seasonally adjusted) from September
House prices now 12% below their November 2021 peak
The key numbers...
- New Zealand house prices fell 0.4% in October, but for the first time since November 2021, house prices in Auckland increased ever so slightly, up 0.3% (both figures seasonally adjusted by Infometrics).
- However, on an annual basis, another national decline in house prices means that house prices sit below October 2021 levels in 14 of New Zealand’s 16 regions. Housing markets in the northern and southernmost regions have experienced the most modest price corrections in the last 12 months, with house prices in Northland and Southland up 1.6% and 3.4% from October 2021 respectively.
- House sales fell 9.6% (seasonally adjusted) in October. Sales activity across every region in New Zealand also remains lower than this time last year, with house sales in Auckland, Canterbury, and Wellington down 42%, 34%, and 18% respectively from October 2021.
- Sales in the last six months have consistently sat between 4,500 and 5,500 houses per month. House sales were last this low consistently through 2008 during the Global Financial Crisis and then again in 2010 and 2011.
- The typical number of days it took to sell a house eased slightly in October, down 1.4% (seasonally adjusted), with median days to sell edging down to 44 days. Days to sell still remain around their highest in over a decade.
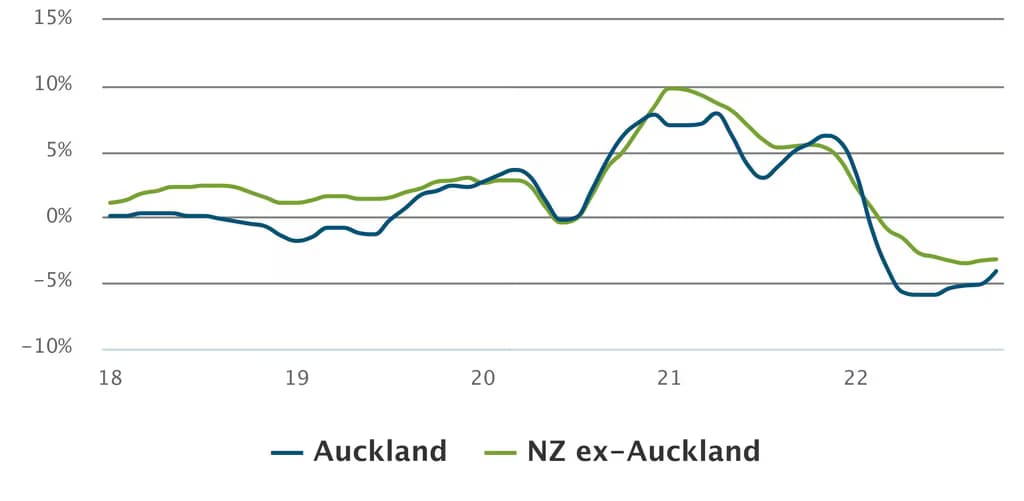
House price declines might be slowing in Auckland
REINZ House Price Index, three-month % changes (sa)
...and our reaction
- Interest rates continued to rise in October, with fixed 1-year mortgage rates increasing by nearly 50 basis points to 5.7% — and floating rates increasing by 50 basis points to 7.3%. Higher interest rates contributed to generally declining house prices in October.
- The increase Auckland’s underlying price trend was surprising given the downwards trend in prices so far in 2022 and the continued interest rate rises. However, it’s only one month of data, and we don’t expect that September was the last monthly price fall for the Auckland housing market, with prices still 20% (seasonally adjusted) higher than in January 2020.
- The slump in house prices so far in 2022 has been strong, with prices in October down 12% (seasonally adjusted) from the November 2021 peak. We expect further declines in house prices in the coming months, but the rate of price falls might be showing some signs of slowing.
Latest updates
Premium

Real estate statistics
House sales and prices still falling
Thu 13 Aug 2026
Monthly
10%pa House sales in July 20260.4%pa House prices from a year earlier 9.3%pa Stock of homes for sale in July 2026
Premium
Real estate statistics
Conflict continues to drag on housing market in June
Wed 15 Jul 2026
Monthly
8.8% House sales between Feb and Jun 2026 (seas adj)0.8% House prices since February (seas adj)4.8% Stock of homes for sale since February (seas adj)Real estate statistics
House buyers dry up ahead of interest rate rises
Mon 15 Jun 2026
Monthly
13%pa House sales in May 20260.6%pa House prices from May 2025 Stock of homes for sale at an 11-year high
Real estate statistics
House prices and sales fall
Thu 14 May 2026
Monthly
7.9%pa House sales in Apr 20260.5% House prices from Mar 2026 (sa)1.2% Stock of homes for sale since Feb 2026 (sa)