Real estate statistics
Obscene house price rises reflect lack of stock for sale
15 Jun 2021

Our take on the latest Real estate statistics (Tue 15 Jun 2021)



House price inflation up to 30%pa
Stock numbers equivalent to just 7.5 weeks of sales
Sales volumes down 5.2% from April (seasonally adjusted)
The key numbers...
- House price inflation surged to 30%pa in May, with prices up 1.5% from the previous month (seasonally adjusted). There are no signs yet of a slowdown in house price growth, although it is too early to expect any effects on prices from the recent rule changes imposed by the government and Reserve Bank.
- Some of the regional rates of price growth are ridiculous, led by Manawatū-Whanganui (52%pa) and Wellington (42%pa). For the first time on record (since 1993), price growth in all regions is above 20%pa.
- Sales volumes were up 1.0% from their May 2019 level (activity in May 2020 was constrained due to lockdown). This result indicates that house sales are still relatively strong, but we note that seasonally adjusted sales have dropped 14% over the last two months.
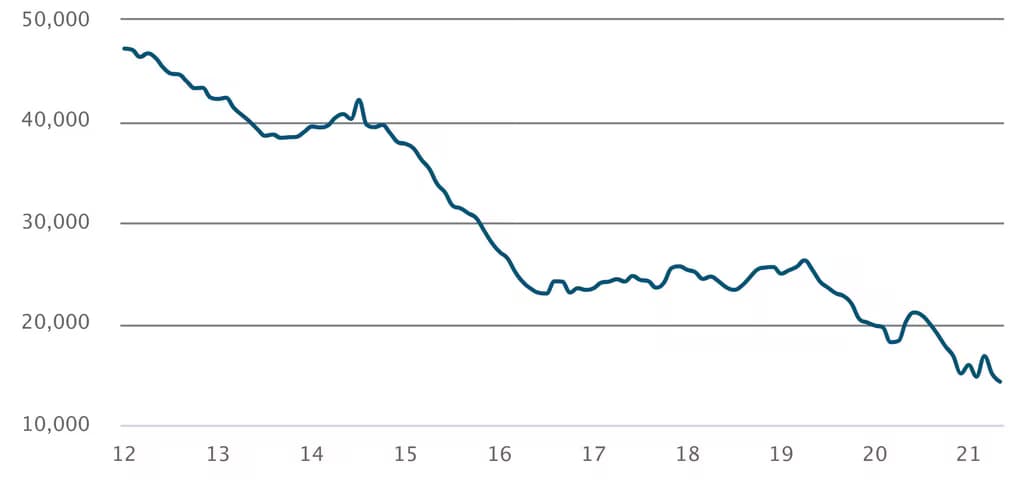
- Critically, the stock of housing for sale on realestate.co.nz sits at just 14,263 properties, less than half the average stock number for the last decade of more than 30,700 properties.
- The median number of days for property to sell edged down from 29.7 days in April to 29.0 days in May (seasonally adjusted). This result is the second-fastest rate of turnover in the last 16 years, behind February 2021, and reinforces the lack of supply.
Stock of properties for sale
Seasonally adjusted
...and our reaction
- An immediate reaction in sales volumes to the government’s rule changes for investors, announced in late March, was always on the cards, but the big unknown is whether monthly price growth will stall by the end of this year as we had expected.
- In line with the decline in sales, Reserve Bank data shows that the proportion of new mortgage lending to investors has eased from 45.2% in January to 37.4% in April, shifting the mix of lending towards owner-occupiers.
- Although we are not perturbed by continuing house price rises, there is real concern that a dearth of properties for sale will maintain an imbalance between demand and supply, resulting in continued competition for properties despite there being fewer buyers in the market.
- Normally strong house price growth draws more sellers into the market, particularly people looking to realise the gains on their investment properties. However, it is possible that the extension of the bright-line test for investors to five years in 2018 is encouraging investors who have subsequently bought property to hold it for longer and not respond to the usual market signals and dynamics.
- Very low interest rates also mean that investors might be reluctant to sell property, faced with a lack of returns available in other investment options.
- Record high numbers of new dwelling consents should theoretically start, over the next year, to alleviate some of the supply issues driving up house prices. However, supply chain disruptions, cost increases, and labour shortages affecting the industry mean that the construction response is progressing more slowly than consent numbers would suggest.
- Risks to our house price forecasts over the next two years remain clearly to the upside, implying that housing affordability will become an even more critical problem.
Latest updates
Premium

Real estate statistics
House sales and prices still falling
Thu 13 Aug 2026
Monthly
 10%pa House sales in July 20260.4%pa House prices from a year earlier9.3%pa Stock of homes for sale in July 2026
Premium
Real estate statistics
Conflict continues to drag on housing market in June
Wed 15 Jul 2026
Monthly
8.8% House sales between Feb and Jun 2026 (seas adj)0.8% House prices since February (seas adj)4.8% Stock of homes for sale since February (seas adj)Real estate statistics
House buyers dry up ahead of interest rate rises
Mon 15 Jun 2026
Monthly
13%pa House sales in May 20260.6%pa House prices from May 2025Stock of homes for sale at an 11-year highReal estate statistics
House prices and sales fall
Thu 14 May 2026
Monthly
7.9%pa House sales in Apr 20260.5% House prices from Mar 2026 (sa) 1.2% Stock of homes for sale since Feb 2026 (sa)