
Our take on the latest Real estate statistics (Tue 18 Feb 2020)


NZ house prices grew by 7.0%pa in January
Excluding Auckland, house prices rose 9.1%pa
House sales increased 3.2%pa
The key numbers...
- The year kicked off with strong house price growth in January, with house price growth outside Auckland particularly strong, at 9.1%pa.
- Regions with the strongest growth were Manawatū-Whanganui (up 20%) and Southland (up 18%pa).
- After declining throughout much of 2019, the number of sales has picked up in recent months, particularly in Auckland, which recorded 9.7%pa growth in January.
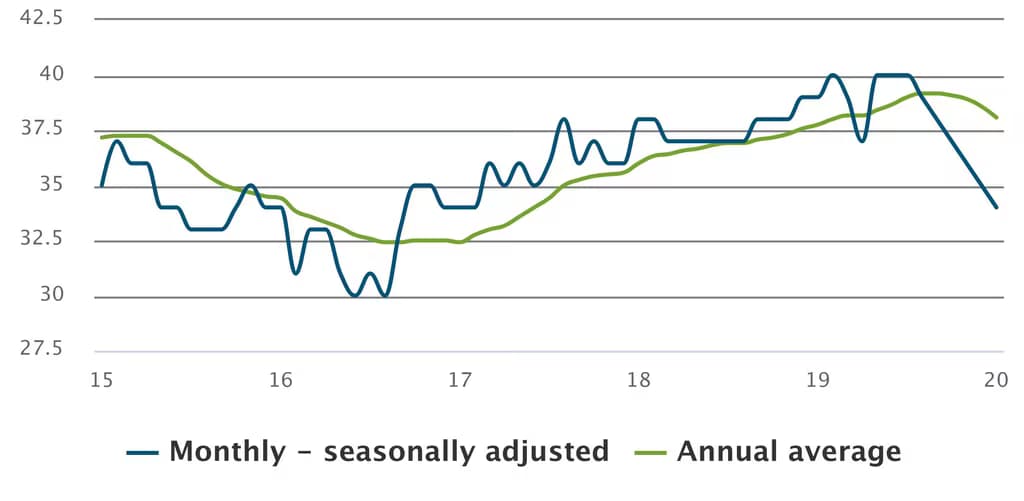
- Property took an average of 42 days to sell in January, down six days from a year ago, as more people rush to secure a property.
Average number of days to sell
Real estate Institute
...and our reaction
- Regions with smaller urban populations have been experiencing greater house price inflation, as prospective buyers have looked outside the relatively overpriced urban centres.
- Nevertheless, low mortgage rates, continued population growth, and renewed investor demand are combining to drive up sales activity and price growth across the country.
- Stronger price growth throughout the next year means that housing affordability will continue to be a big talking point during 2020.
- The housing market’s strength poses upside risks to our residential building forecasts, raising the chance that the peak in activity is higher and later than we currently expect.
Latest updates
Premium

Real estate statistics
House sales and prices still falling
Thu 13 Aug 2026
Monthly
 10%pa House sales in July 20260.4%pa House prices from a year earlier9.3%pa Stock of homes for sale in July 2026
Premium
Real estate statistics
Conflict continues to drag on housing market in June
Wed 15 Jul 2026
Monthly
8.8% House sales between Feb and Jun 2026 (seas adj)0.8% House prices since February (seas adj)4.8% Stock of homes for sale since February (seas adj)Real estate statistics
House buyers dry up ahead of interest rate rises
Mon 15 Jun 2026
Monthly
13%pa House sales in May 20260.6%pa House prices from May 2025 Stock of homes for sale at an 11-year high
Real estate statistics
House prices and sales fall
Thu 14 May 2026
Monthly
7.9%pa House sales in Apr 20260.5% House prices from Mar 2026 (sa)1.2% Stock of homes for sale since Feb 2026 (sa)