
Our take on the latest Real estate statistics (Fri 12 Jul 2019)



NZ house price growth at 1.7%pa growth
Seasonally adjusted house sales edge up
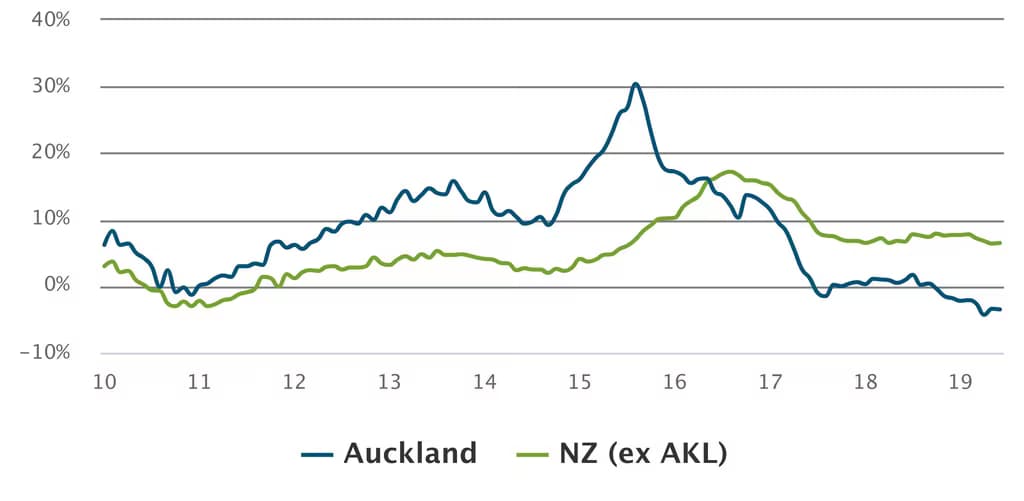
Auckland house prices down by 3.5%pa
The key numbers...
- While price trends remain the same, the slight recovery in the number of house sales, particularly in Auckland and Canterbury, could reflect peoples’ willingness to re-enter New Zealand’s largest housing markets.
- Nine months of falling house prices in Auckland and the abandonment of the capital gains tax could be enticing some new buyers in the big smoke.
- However, in our view, this month’s slight recovery in the number of sales in Auckland reflects the lack of activity in recent months more than anything else.
House prices
Annual percentage change
...and our reaction
- House price inflation remained unchanged at 1.7%pa in June.
- House prices outside Auckland grew 6.5%pa, with every region showing positive house price inflation. Meanwhile, house prices in Auckland fell 3.5%pa.
- Other regions with notable house price inflation were Southland and Manawatū-Whanganui, up 20%pa and 18%pa respectively.
- Seasonally adjusted sales volumes in Auckland are up 12.3% from May, with a 5.5% lift recorded in Canterbury.
- House sales outside Auckland and Canterbury dropped 5.4%pa, with sales in Hawkes Bay and Taranaki slumping the most, down 27%pa and 25%pa respectively.
- Buyers have the luxury of taking their time when considering purchasing property – the median number of days to sell has reached an eight-year high in seasonally adjusted terms.
Latest updates
Premium

Real estate statistics
House sales and prices still falling
Thu 13 Aug 2026
Monthly
10%pa House sales in July 20260.4%pa House prices from a year earlier 9.3%pa Stock of homes for sale in July 2026
Premium
Real estate statistics
Conflict continues to drag on housing market in June
Wed 15 Jul 2026
Monthly
8.8% House sales between Feb and Jun 2026 (seas adj)0.8% House prices since February (seas adj)4.8% Stock of homes for sale since February (seas adj)Real estate statistics
House buyers dry up ahead of interest rate rises
Mon 15 Jun 2026
Monthly
13%pa House sales in May 20260.6%pa House prices from May 2025 Stock of homes for sale at an 11-year high
Real estate statistics
House prices and sales fall
Thu 14 May 2026
Monthly
7.9%pa House sales in Apr 20260.5% House prices from Mar 2026 (sa)1.2% Stock of homes for sale since Feb 2026 (sa)