
Our take on the latest Ready-mixed concrete (Wed 12 Nov 2025)


Concrete volumes in Sep quarter up 2.3% from Jun (sa)
Annual concrete volumes down by 6.2%pa
Annual concrete volumes in Otago/Southland up by 5.1%pa
The key numbers...
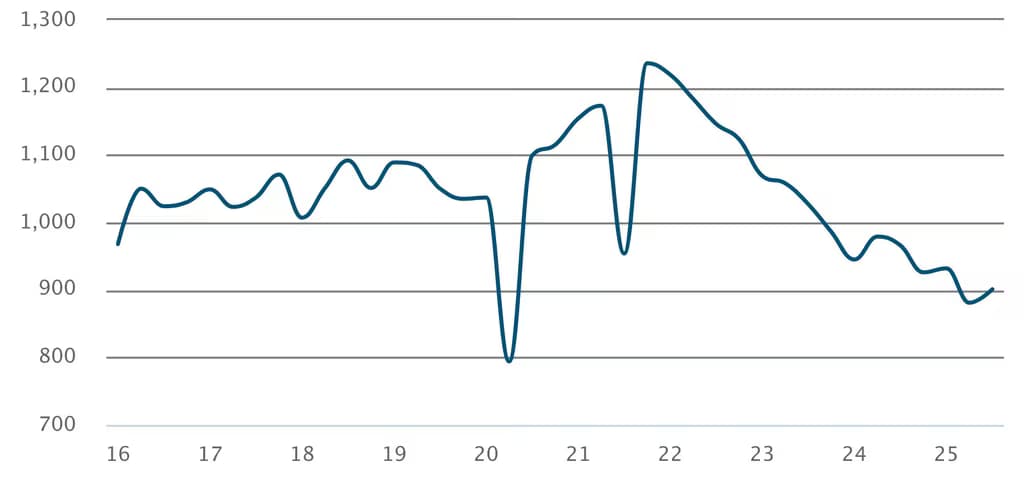
- Ready-mixed concrete volumes rose 2.3% in the September 2025 quarter from the June quarter to 901,000 cubic metres (seasonally adjusted). The increase is just the third quarterly lift since December 2021, with the other two increases coming in June 2024 (+3.6%) and March 2025 (+0.7%).
- Despite the rise in volumes, September was still the second weakest quarter since March 2014, with only June 2025 quarterly volumes being lower (excluding the lockdown-affected June 2020 quarter, all figures seasonally adjusted).
- Annual ready-mixed concrete volumes fell to 3.64m cubic metres in September 2025, the lowest annual volume since September 2014.
- Nevertheless, annual ready-mix concrete volumes were higher than a year ago in Otago/Southland (+5.1%pa), the first increase for any of the eight broad regions in two years.
- In terms of the year-end falls, the wider Taranaki/Manawatu-Whanganui/Wellington area led the declines (down 13%), followed by Northland (-12%) and West Coast/Tasman/Nelson/Marlborough (-10%). The smallest declines were seen in Auckland (-4.4%), and Canterbury (-5.5%).
- Annual volumes in the metropolitan areas continued to decline, with falls in Christchurch City accelerating to 8.5%pa. The Wellington metro area remains in sharp decline, falling 15%pa as annual declines extended to 15 consecutive quarters. The Auckland metro areas recorded the smallest decline, at 2.5%pa, implying that the largest falls in the Auckland region are occurring in the outlying Rodney and Franklin areas.
Small increase, but weakness still severe
000m3, quarterly ready-mixed concrete volumes, seas. adj.
...and our reaction
- The outlook for ready-mixed concrete demand is mild, as levels of construction activity remain subdued. Annual concrete volumes are now 24% below their peak during the year to September 2022. Despite the extent of the current decline, it is important to look through the mid-2021 to mid-2023 period as construction activity was unsustainably high.
- We expect non-residential construction activity to fall throughout 2026 following weaker consents in 2025, reaching its low point at the end of 2026. Non-residential construction activity tends to lag the economic cycle due to the longer lead times for planning and building larger commercial buildings, with expected conditions next year mirroring the economic conditions of 2025.
- Residential construction activity should hold up near to current levels over the next 18-24 months, as dwelling consents appear to be rallying off the back of lower interest rates. However, over the longer term we expect weak population growth to weigh on activity and therefore demand for ready-mixed concrete.
- We continue to communicate upside risks to other construction activity due to government infrastructure activity that is in the pipeline, with its July announcement of $6b of projects due to get underway by the end of this year (with the package including both social and civil infrastructure). We have maintained a cautious growth forecast for infrastructure activity during 2026 due to projects taking longer to get through the planning and design phase than the government expects.
Latest updates
Premium

Ready-mixed concrete
Further concrete rise supported by South Island growth
Wed 12 Aug 2026
Quarterly
12%pa Concrete volumes in Jun 2026 quarter 22%pa Concrete volumes in the South Island
 Volumes above 1 million m3 for the first time in 2½ years
Premium
Ready-mixed concrete
South Island drives continued growth in concrete
Tue 12 May 2026
Quarterly
1.8%pa Concrete volumes in Mar 2026 quarter1.1% Concrete volumes from Dec 2025 quarter (sa)21% Christchurch concrete volumes from Mar 2025 quarterReady-mixed concrete
A turning point for concrete volumes?
Wed 11 Feb 2026
Quarterly
0.4%pa Concrete volumes from Dec 2024 quarter2.4% Concrete volumes from Sep 2025 quarter (sa)South Island leads growth