
Our take on the latest Employment indicators (Mon 30 Jun 2025)

Filled jobs up 0.1% in May (sa)
Primary industry jobs up 0.4% in May (sa)
Job ads up 3.5% in May (sa)
The key numbers...
- Filled job numbers rose just 0.1% in May from April (seasonally adjusted). Last month's narrow 0.1% decline was revised down to a 0.3% decline. May’s narrow rise could be revised to flat or negative growth in future releases.
- Primary industries filled jobs rose 0.4% in May from April (seasonally adjusted) and were higher than a year ago for the first time since October 2024 (+1.0%pa). Declines in filled jobs in goods-producing industries continued, falling 0.2% from April, down 4.0%pa from a year ago. Service industries are lacking any real trend, with month-to-month changes bouncing between positive and negative over the past nine months, resulting in a largely immaterial 0.1% decline from September 2024 (seasonally adjusted).
- Across the regions, trends have been relatively consistent over the past six months. The decline in the South Island (-0.4%pa) remains more muted than in the North Island (-1.7%pa), and the annual decline is slowed across both islands, to their lowest since November 2024. Auckland (-1.9%pa) and Wellington (-2.2%pa) remain above the national average decline (-1.4%pa), and Southland (+0.4%pa) is the only region in positive territory.
- Job ads in May rose 3.5% from April (based on Infometrics seasonal adjustment of MBIE data). The job ads index is now at its highest in a year but remains relatively low (down 37% from two years ago), indicating that a material turnaround won’t come quickly.
Full year of annual filled job declines
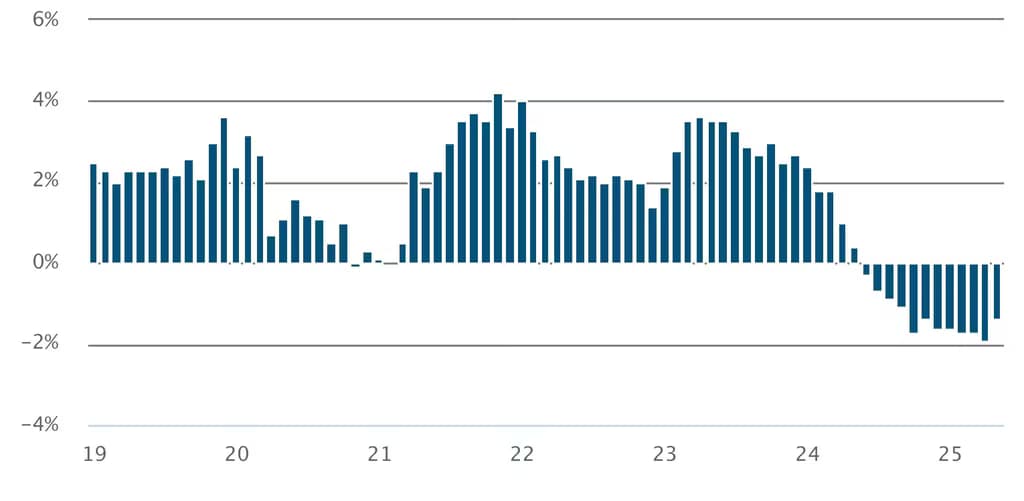
Filled jobs, annual % change
...and our reaction
- Filled job numbers have been lower than a year ago for twelve consecutive months, with the revised April decline reaching –1.9%pa, the largest decline in this downturn. The annual decline in May was a smaller -1.4%pa decline but was largely a function of a large 0.4% monthly decline in May 2024.
- Filled jobs in the agriculture, forestry, and fishing industry were higher than a year ago (+1.3%pa) for the first time since March 2024, likely reflecting higher commodity prices and export volumes we have seen across dairy, meat and horticulture over the past year. Filled jobs across most industries remain lower than a year ago with some exceptions, largely due to industry specific drivers including mining (+3.9%pa), utilities (+1.0%pa), education (+1.3%pa), and health care (+2.2%pa).
- Given the sharp decline in April, it looks like there is scope for the unemployment rate to pick up in the June 2025 quarterly data, although the monthly employment indicators (MEIs) and the household labour force survey (HLFS) do not always move in tandem, with the MEIs based off administrative data and the HLFS based off survey data. The unemployment rate remained flat at 5.1% in the March 2025 quarter, but most analysts have been anticipating a peak of around 5.3-5.4% in the June quarter before conditions slowly improve over the remainder of 2025.
Latest updates
Premium

Employment indicators
Further weak employment recovery
Tue 28 Jul 2026
Monthly
0.1% Filled jobs rose in June 2026 (sa)0.6%pa Filled jobs were up from June 2025 1.5%pa South Island filled jobs incre from June 2025
Premium
Employment indicators
Public sector leads job gains
Mon 29 Jun 2026
Monthly
0.3% Filled jobs in May (sa) 0.1% Filled jobs in April (sa)0.7% Filled jobs from May 2025
Employment indicators
Healthcare leads job growth
Thu 28 May 2026
Monthly
0.2% Filled jobs in April (sa)0.5% Filled jobs from April 20255,527 Healthcare jobs over the year to AprilEmployment indicators
Let’s hear it for the South
Tue 28 Apr 2026
Monthly
0.3% Filled jobs in March (sa)0.2% Filled jobs in February (sa)1.5%pa South Island jobs in March