Employment indicators
Filled jobs decline narrowly, monthly data still volatile
28 May 2025

Our take on the latest Employment indicators (Wed 28 May 2025)

Filled jobs down 0.1% in April (sa)
Goods-producing industries jobs down 0.3% in April (sa)
Job ads down 1.0% in April (sa)
The key numbers...
- Filled job numbers fell 0.1% in April from March (seasonally adjusted). Filled jobs have not recorded two consecutive month-to-month changes of the same sign for six months.
- Filled jobs across the three broad sectors remain volatile also, and trends are mixed. Primary industries filled jobs rose for the third consecutive month (+0.1%), for the first time since October 2021, although a revision in coming months could turn the rise to flat or even negative. Service industries (-0.1%) fell and remain volatile, and they have been unable to record consecutive months of the same sign for seven months.
- Revisions to last month’s filled job numbers saw the slight rise in goods-producing filled jobs revised down to a fall, and another fall of -0.3% in April extends the monthly declines to 15 consecutive months for this broad sector.
- Job ads in April fell 1.0% from March (based on Infometrics seasonal adjustment of MBIE data). We continue to monitor job ad figures to give an early indication of a turning point in the labour market. However, there are no clear signs yet, with job ads largely flat at low levels for the past nine months.
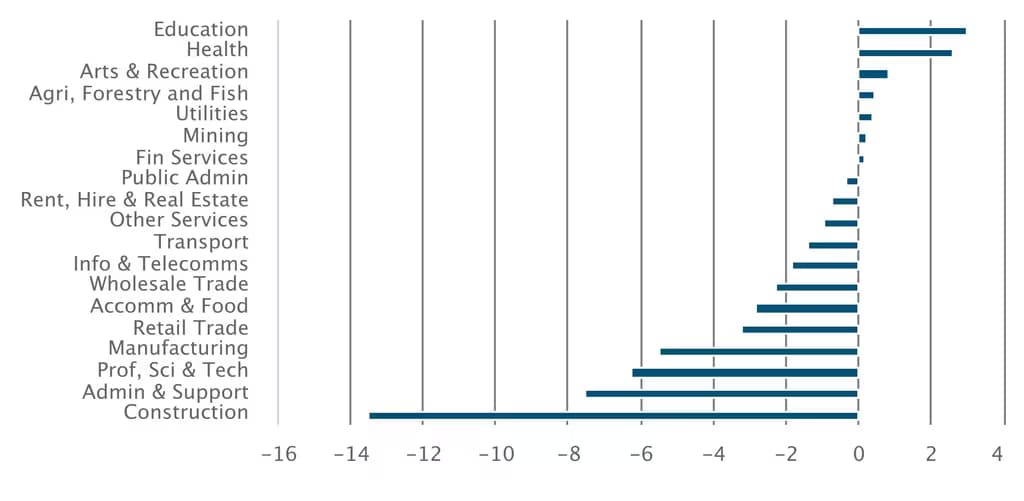
Employment decline broad based with few exceptions
Filled jobs by industry, annual change, April 2025 (000's)
...and our reaction
- Filled job numbers in April were 1.6% lower than a year ago. Annual declines have bounced around 1.6-1.7% over the past five months, with the largest declines in goods-producing industries (-4.2%), followed by service industries (-1.1%). Primary industries have bucked the trend, rising 0.2%.
- The annual decline has been largely broad based with few exceptions. Employment across the health and education industries has risen, adding 3,000 and 2,600 jobs respectively. The construction workforce has been contracting significantly, with annual declines extending to 13 months in April. The annual decline is now 6.5%pa, equating to 13,500 fewer jobs.
- The unemployment rate remained at 5.1% in the March quarter, failing to rise to the 5.3% expected by most analysts. This outcome might not change the timing of the peak in the unemployment rate that we have been picking for several quarters, estimated to be 5.4% in the current June 2025 quarter. However, the global trade war has thrown more uncertainty for businesses to navigate through, which could result in a slower pick-up in employment and reduction in the unemployment rate from its peak.
Latest updates
Premium

Employment indicators
Further weak employment recovery
Tue 28 Jul 2026
Monthly
 0.1% Filled jobs rose in June 2026 (sa)0.6%pa Filled jobs were up from June 2025
 1.5%pa South Island filled jobs incre from June 2025
Premium
Employment indicators
Public sector leads job gains
Mon 29 Jun 2026
Monthly
0.3% Filled jobs in May (sa) 0.1% Filled jobs in April (sa)0.7% Filled jobs from May 2025
Employment indicators
Healthcare leads job growth
Thu 28 May 2026
Monthly
0.2% Filled jobs in April (sa)0.5% Filled jobs from April 20255,527 Healthcare jobs over the year to AprilEmployment indicators
Let’s hear it for the South
Tue 28 Apr 2026
Monthly
0.3% Filled jobs in March (sa)0.2% Filled jobs in February (sa)1.5%pa South Island jobs in March