
Our take on the latest Employment indicators (Fri 4 Oct 2024)


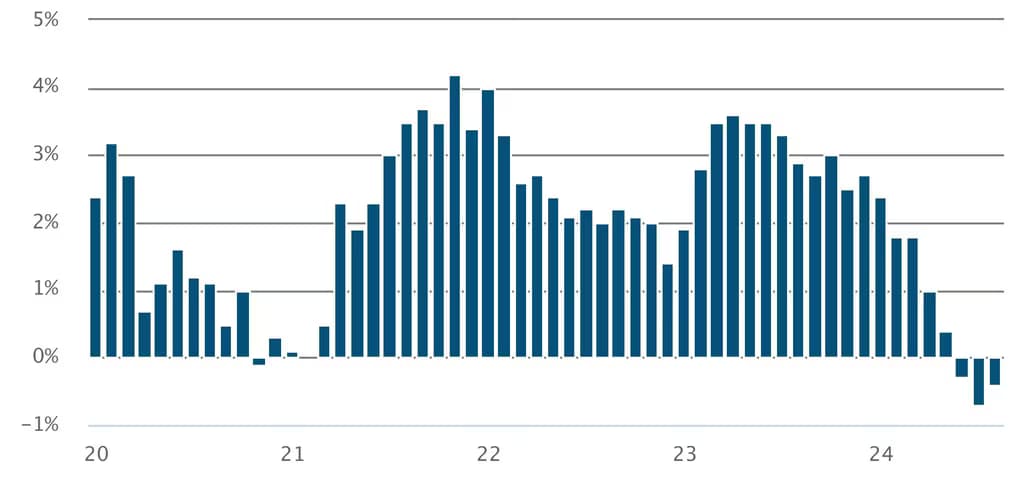
Annual filled jobs down 0.4%pa in August
Filled jobs up 0.2% in August from July (seasonally adjusted)
Goods-producing industries filled jobs down 1.9%pa in August
The key numbers...
- Filled job numbers edged up in August, following four consecutive months of declines, up 0.2% from July (seasonally adjusted).
- Annual filled jobs growth remained negative (-0.4%pa), despite the slight monthly rise. August marks three consecutive months of declines in annual filled jobs growth for the first time since mid-2010.
- Growth in filled jobs by sector remains mixed. Annual growth in primary industries turned positive for the first time in three months, up 0.4%pa, while goods-producing industries growth remained negative, down 1.9%pa, down for five consecutive months for the first time since mid-2011.
- At an industry level, results are also mixed, many industries declined, but some bucked the trend, as electricity, gas, water and waste services filled jobs are up 5.1%pa and health care and social assistance up 4.3%. The construction industry is one of the country’s biggest employers, and showed real weakness as filled jobs fell 3.9%pa. Administrative and support services, which includes labour hire services, also declined 6.9%pa.
Negative annual jobs growth continues
Filled jobs, annual % change
...and our reaction
- Job numbers have remained below this time last year for the third consecutive month, illustrating the hardship many businesses are suffering as demand remains weak. As difficult conditions continue, there continues to be mounting risks of the unemployment rate pushing beyond our current forecast peak of 5.3% next year.
- The labour market continues to be tough for young people, as the number of jobs filled by under-30-year-olds continues to decline, down 6.1%pa in August. The number of jobs filled by 15-19-year-olds also continues to fall, down 13%pa. Growth in jobs filled by over-30-year-olds continues to hold up, rising 1.1%pa, although positive, this remains well below the 3.0%pa+ growth seen through last year.
- Job numbers in the South Island continue to hold up stronger than the North Island, with filled jobs in the South up 0.3%pa from a year ago, while the number of filled jobs in the North Island is down 0.6%pa.
- Southland, West Coast, and Canterbury saw the largest growth in annual filled jobs, up 0.5-1.0%pa. The regions that saw the largest declines were Nelson, Taranaki, Wellington, and Auckland, all recording falls of 0.9-1.6%pa.
Latest updates
Premium

Employment indicators
Further weak employment recovery
Tue 28 Jul 2026
Monthly
 0.1% Filled jobs rose in June 2026 (sa)0.6%pa Filled jobs were up from June 20251.5%pa South Island filled jobs incre from June 2025
Premium
Employment indicators
Public sector leads job gains
Mon 29 Jun 2026
Monthly
0.3% Filled jobs in May (sa)0.1% Filled jobs in April (sa)0.7% Filled jobs from May 2025Employment indicators
Healthcare leads job growth
Thu 28 May 2026
Monthly
0.2% Filled jobs in April (sa)0.5% Filled jobs from April 20255,527 Healthcare jobs over the year to AprilEmployment indicators
Let’s hear it for the South
Tue 28 Apr 2026
Monthly
0.3% Filled jobs in March (sa)0.2% Filled jobs in February (sa)1.5%pa South Island jobs in March