Employment indicators
Filled job numbers continue sharp decline for under-30s
28 Aug 2024

Our take on the latest Employment indicators (Wed 28 Aug 2024)

Filled jobs down 0.1% in July from June (seasonally adjusted)
Goods-producing industries filled jobs down 2.0%pa in July
Under-30s filled jobs down 6.3%pa in June
The key numbers...
- Filled job numbers edged lower in July, for the fourth consecutive month, down 0.1% from June (seasonally adjusted).
- Annual filled jobs growth turned negative in June with recent revisions, the first fall since November 2020 July’s 0.5%pa was the biggest annual decline in over 14 years.
- Growth in filled jobs by industry remains volatile for primary industries, bouncing up to 0.1%pa after turning negative in May and June. Service industries filled jobs fell for the first time since February 2021, down 0.2%pa. Goods-producing industries continue to be the weakest (down 2.0%pa), the largest annual decline since May 2010.
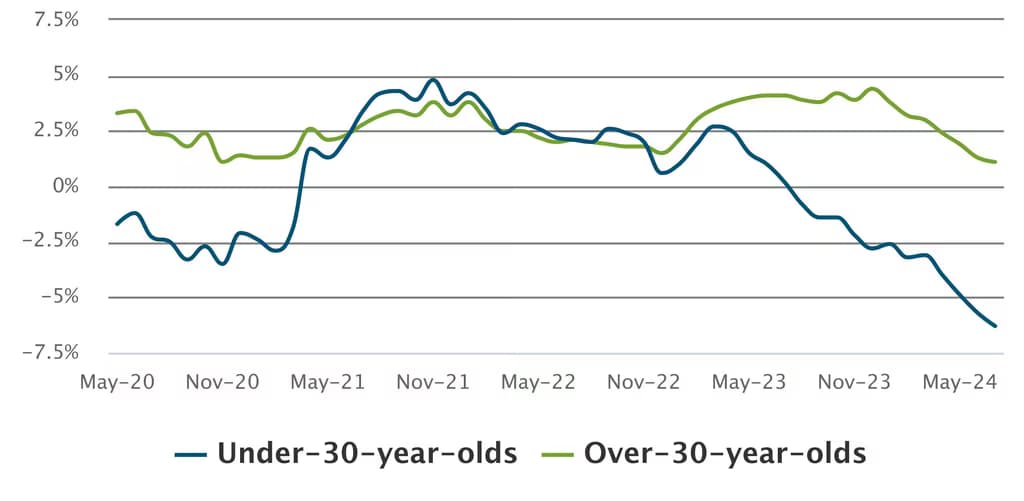
- The number of jobs filled by under-30-year-olds fell by 6.3%pa in July. Jobs filled by over-30-year-olds have risen 1.1%pa, and although growth remains positive for this demographic, it is the slowest rate since November 2020. The fall in the number of jobs filled by 15-19-year-olds continues to worsen, down 13%pa, the largest decline on record (figures back to September 2020).
Jobs filled by under-30s continue sharp decline
Annual % change, monthly filled jobs
...and our reaction
- Job numbers have continued to fall, with businesses struggling with weak demand and high input costs. There are mounting risks that the unemployment rate pushes higher than our current forecast peak of 5.3% next year.
- Admin and support services continue to lead the decline, with filled jobs down 6.4%pa, followed by construction filled jobs reflecting weaker activity across the industry, down 3.2%pa.
- Positive job growth remains in public administration and safety at 2.3%pa, but we are yet to see the full effect of public sector job losses. Any reduction in filled jobs from a redundancy payment will be represented in the data in the month following an employee’s final pay.
- Job numbers in the South Island continue to hold up stronger than the North Island, with filled jobs in the South unchanged from a year ago, while the number of filled jobs in the North Island is down 0.6%pa.
- Northland and Canterbury continue to buck the trend, with filled jobs in these regions up 0.6%pa and 0.3%pa respectively. The regions that saw the largest declines were Gisborne, Taranaki, Tasman, Nelson, and Wellington, all recording falls of 1.4-1.8%pa.
- The recent official cash rate cut from the Reserve Bank will provide businesses with some certainty about lower debt-servicing costs going forward, but weak demand conditions will remain an issue in terms of cash flow and profitability. Households will also welcome the cut with the eventual drop in their mortgage rates, freeing up funds for discretionary spending, although weakness in the labour market and uncertainty over job security are likely to be the dominant driver of spending patterns over the next year.
Latest updates
Premium

Employment indicators
Further weak employment recovery
Tue 28 Jul 2026
Monthly
 0.1% Filled jobs rose in June 2026 (sa)0.6%pa Filled jobs were up from June 2025
 1.5%pa South Island filled jobs incre from June 2025
Premium
Employment indicators
Public sector leads job gains
Mon 29 Jun 2026
Monthly
0.3% Filled jobs in May (sa)0.1% Filled jobs in April (sa)0.7% Filled jobs from May 2025Employment indicators
Healthcare leads job growth
Thu 28 May 2026
Monthly
0.2% Filled jobs in April (sa)0.5% Filled jobs from April 20255,527 Healthcare jobs over the year to AprilEmployment indicators
Let’s hear it for the South
Tue 28 Apr 2026
Monthly
0.3% Filled jobs in March (sa)0.2% Filled jobs in February (sa)1.5%pa South Island jobs in March