
Our take on the latest Employment indicators (Mon 28 Aug 2023)



Filled jobs up 0.3% in July (seasonally adjusted)
Public admin and safety jobs growth accelerates to 6.3%pa
Growth in earnings per filled job remains at around 6.0%pa
The key numbers...
- Filled jobs rose 0.3% in July from June (seasonally adjusted), with continued increases across both goods-producing and services industries.
- Total filled jobs are up 3.5%pa on average over the last three months, a steady growth trend since May 2023.
- Jobs growth in Auckland has accelerated in recent months, with 4.3%pa annual growth seen in July 2023, with an extra 33,000 jobs added over the last year. Parts of the South Island are also seeing faster gains (Marlborough and the West Coast grew 5.1%pa, and Otago was up 4.1%). Jobs growth continues in cyclone-affected Hawke’s Bay and Gisborne, but at a slower pace than in most regions.
- The number of 20-24 year old workers has dropped 1.3% over the last year, but employment has risen across all other age groups.
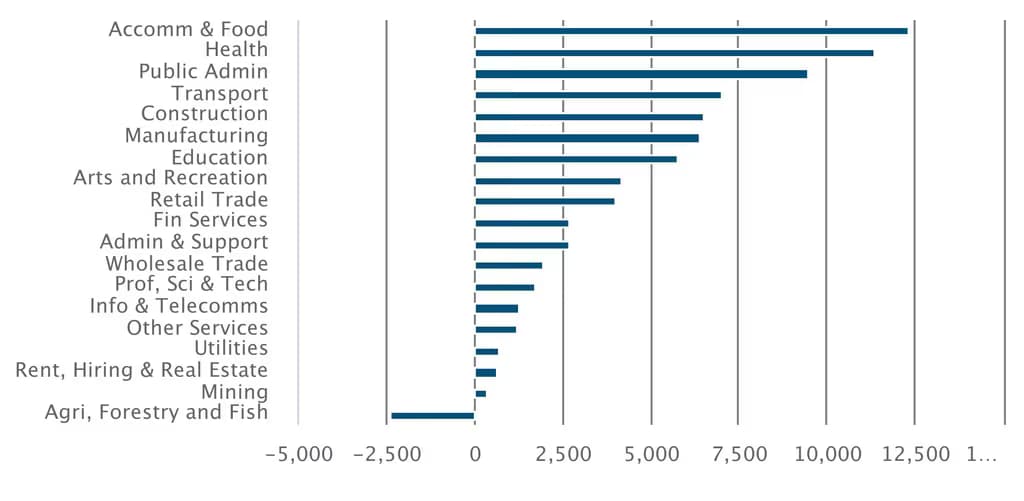
- Accommodation and food services have seen the largest increase in job numbers, up 8.4%pa, with large contributions from the health industry too (up 4.4%). Public administration and safety employment has accelerated to 6.3%pa, the fastest acceleration of any industry. Professional services employment growth rose 0.9%pa, the slowest in nearly 3 years. Meanwhile, construction jobs have been hovering at current levels for the last 4-5 months.
- Growth in earnings per filled job have stabilised at 6.0%pa over the 12 months to July 2023, down from the 7-8%pa seen in 2021/22.
Employment trends show some moderation, some acceleration
Annual change in filled jobs
...and our reaction
- Jobs growth is continuing, and although there’s no sign of a slow down in hiring yet, there does seem to be a stabilisation of sorts occurring, with the three-month annual growth rate plateauing.
- Greater labour supply and this stabilisation in jobs growth have both contributed to a moderation in earnings per filled jobs, and although this measure remains high, the moderation so far reinforces other wages data that shows labour cost growth might also be plateauing.
- Stronger employment growth in Auckland strengthens our view that migration is likely most concentrated around Auckland first and foremost, with 45% of jobs growth over the last year being in Auckland alone.
- Higher net migration might be increasing the labour pool in general, but recent falls in filled jobs in the 20-24 age group also highlights a continued outflow of younger Kiwis, although the number of workers aged 30-44 have grown considerably in the last 12 months.
- More limited employment growth in construction and professional services, previously two of the key drivers of jobs growth, shows that there’s a slowing in momentum occurring across the economy. The rise in accommodation and food services is part of the continued revival of the tourism sector.
- But the rise in public sector employment is curious at a time when the fiscal position is being tested. Employment will rise considerably in the public sector in the month before and month of the election (as happened in 2020, as short-term electoral workers are employed just for the election itself), but the acceleration in hiring in recent times is unusual.
Latest updates
Premium

Employment indicators
Further weak employment recovery
Tue 28 Jul 2026
Monthly
0.1% Filled jobs rose in June 2026 (sa)0.6%pa Filled jobs were up from June 20251.5%pa South Island filled jobs incre from June 2025Premium
Employment indicators
Public sector leads job gains
Mon 29 Jun 2026
Monthly
0.3% Filled jobs in May (sa) 0.1% Filled jobs in April (sa)0.7% Filled jobs from May 2025
Employment indicators
Healthcare leads job growth
Thu 28 May 2026
Monthly
0.2% Filled jobs in April (sa)0.5% Filled jobs from April 20255,527 Healthcare jobs over the year to AprilEmployment indicators
Let’s hear it for the South
Tue 28 Apr 2026
Monthly
0.3% Filled jobs in March (sa)0.2% Filled jobs in February (sa)1.5%pa South Island jobs in March