Articles
14 articles found for
- 1(current)
- 2
Analysis
Two-thirds of New Zealand areas have local Easter trading policies

Analysis
Two-thirds of New Zealand areas have local Easter trading policies
Wed 27 Apr 2022Brad Olsen🕓 5 min
Chart of the month
A Month of Maps
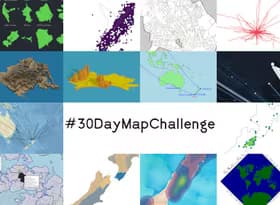
Chart of the month
A Month of Maps
Tue 30 Nov 2021David Friggens🕓 12 min
Analysis
Population shift: provinces rise, urbans fall
Analysis
Population shift: provinces rise, urbans fall
Thu 28 Oct 2021Brad Olsen🕓 4 min
Analysis
Counting the cost of the Delta Lockdown
Analysis
Counting the cost of the Delta Lockdown
Wed 29 Sept 2021Brad Olsen🕓 5 min
Analysis
How hard is the housing market around the regions?

Analysis
How hard is the housing market around the regions?
Wed 25 Aug 2021Nick Brunsdon🕓 4 min
Premium
Analysis
The flow of goods has changed since COVID-19
Analysis
The flow of goods has changed since COVID-19
Thu 13 May 2021Andrew Beattie🕓 3 min
Chart of the month
Month of the Chart

Chart of the month
Month of the Chart
Thu 29 Apr 2021David Friggens🕓 6 min
Analysis
The shape of exports and how they shape us
Analysis
The shape of exports and how they shape us
Thu 29 Apr 2021Andrew Beattie🕓 3 min
Chart of the month
Could New Zealand’s chocolate sector expand?
Chart of the month
Could New Zealand’s chocolate sector expand?
Wed 31 Mar 2021Brad Olsen🕓 2 min
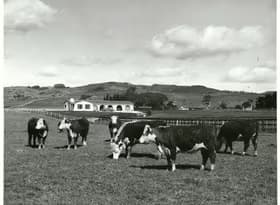
Analysis
Dairy sector growth flat lines as we pass peak dairy
Analysis
Dairy sector growth flat lines as we pass peak dairy
Wed 17 Feb 2021Nick Brunsdon🕓 3 min
- 1(current)
- 2