New Zealand households are spending more but getting less for it. The latest electronic card transactions data points to a growing disconnect between nominal spending and actual consumption, as sharp rises in fuel prices push up total outlays while underlying volumes continue to decline. This dynamic is not limited to the petrol station: across the economy, higher prices appear to be masking softer demand, with early signs that households are beginning to reprioritise their spending in response to the fuel price shock. In this analysis, we unpack what’s really happening beneath the surface of the spending data, explore the emerging evidence of volume weakness, and explain why traditional inflation measures can mislead when interpreting retail activity.
Higher prices, higher spending, but lower volumes
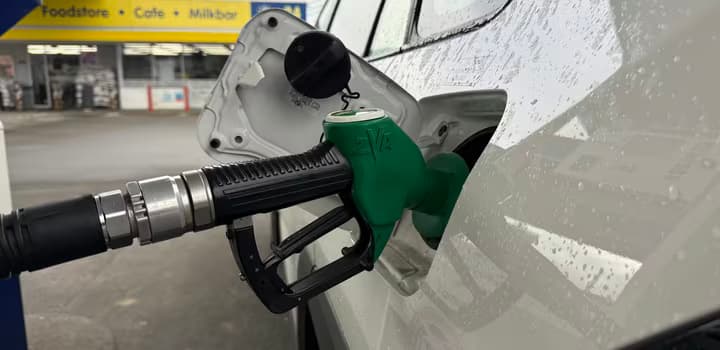
Stats NZ’s electronic card transactions data shows fuel spending spiked 10%pa in March, with $583m spent on fuel over the month. Although by no means a record spending month for fuel, the increase was still substantial.
Infometrics analysis of MBIE weekly fuel price data shows that 91 petrol prices rose 13%pa on average in the March month, to $2.98/L, and diesel prices rose 34% on average in the month to $2.61/L. Although end of month prices were substantially higher, the spending figures are the total for the month, and so examining monthly average prices is also important, as some motorists will have filled up earlier in the month when prices were rising fast but still lower than currently, and others will have filled up later in the month at even higher prices.
Given the electronic card transactions data is for all fuel, we have weighted the different fuel types by the weights each have (91, 95/98, and diesel) in the consumers price index to produce an aggregate fuel price increase of 14%pa in the March 2026 month.
Taking these figures together, Infometrics estimates that actual fuel volumes purchased (in terms of litres of fuel) were down about 3.6% from a year ago.
Interestingly, our estimates also suggest that, based on similar assumptions for previous months, actual fuel volumes purchased have likely been falling for most of the last 2½ years.
Early signs of a switch in spending priorities
The electronic card spending data also showed early signs of how New Zealanders are adjusting their spending. Spending was higher than a year ago across most categories, with the seasonally adjusted monthly change in spending providing more of a clue on the latest spending behaviour.
Households continued to spend on consumables (mostly food and groceries), and also spend more on durables (larger, non-perishable items, like furniture or electronics), as well as services, and cars.
But spending on apparel dropped 4.2% from a year earlier in March and was down 4.2% from February as well, the largest monthly spending drop since mid-2024 for this category, and the largest annual decline since mid-2025.
Hospitality spending was more restrained too, up just 0.2%pa in March, and down 2.4% from February on a seasonally adjusted basis. With none of the electronic card data being adjusted for price changes, rising spending is likely to be as much driven by price increases than higher volumes being purchased.
Overall, core electronic card spending (excluding motor vehicles and fuel) fell 0.1% in March from February (seasonally adjusted), an unremarkable change given there was a sharp increase in spending in February, and monthly spending declines in both January and December.
So far, there’s limited evidence of household demand destruction, but we expect it to appear shortly. Demand destruction is where high prices, reduced income, or other constraints cause a lasting reduction in the quantity of a good or service demanded – essentially a persistent shift in spending habits, rather than a temporary dip.
Spending figures are always difficult to interpret, and the next monthly figures in April will be no different. Not only will higher fuel prices continue to influence spending decisions, but the Easter and Anzac Day long weekends, a cyclone warning, and intense weather conditions across the month could shift spending behaviour considerably.
Why retail inflation is different from headline inflation
We are often asked why we don’t, or if we should, adjust retail spending data for inflation. The question is most common around quarterly card spending data in our Quarterly Economic Monitor, which is total retail card spending in merchants in an area, provided by Marketview.
One key reason is that inflation – commonly reported as the annual change in the consumers price index (CPI) – doesn’t accurately reflect prices for retail card spending activity.
Our back-of-the-envelope estimates suggest that at least one third of the weighted CPI basket is never purchased using a card. This group includes items like rent (11.2% of the basket), building costs (9.5%), local council rates (3.1%), energy, cars, education, and more. Other items are services items, which may or may not sit within all the various electronic card spending definitions around the place.
Instead, we think a retail-focused inflation adjustment is more appropriate. Stats NZ already publishes retail trade deflators by spending type, but there is not an overall spending deflator.
So we’ve made our own, an implicit retail spending deflator, for core and total retail spending. Similar to the approach taken for the implicit GDP deflator, our implicit retail spending deflator compares the difference in aggregate nominal and real (price-adjusted) retail spending, for core and total spending, each quarter.
Recently, headline inflation has been rising at a stronger pace than our implicit retail deflators, with higher energy prices and local government rates some of the key drivers – items that are not regularly purchased with cards. If we adjusted card spending simply for headline inflation, at the moment it is likely that we would be overstating the price impact on spending and undercooking the change in spending volumes.
We expect to continue to report on our implicit retail price deflators more in the future, but welcome any feedback on our broad approach and thinking.