Articles
51 articles found for
Chart of the month
A more frequent state of emergency
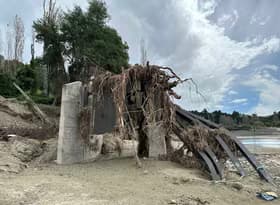
Chart of the month
A more frequent state of emergency
Resilience continues to be an important long-term factor for the New Zealand economy, and our Chart of the Month highlights the continued emergency challenges we face over time.
Analysis
Being green and saving money

Analysis
Being green and saving money
Many of us have come to accept that doing the right thing for the environment comes with a higher cost. However, our recent analysis for the New Zealand Green Building Council (NZGBC) found that households can be substantially better off with the benefits of a greener home.
Chart of the month
Swimming into 2025
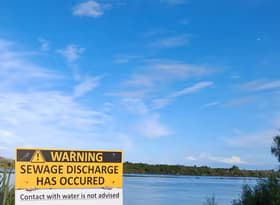
Chart of the month
Swimming into 2025
Swimming at our picturesque beaches, rivers and lakes is a Kiwi summer staple as many of us have time off in the summer months. Sometimes our favourite swimming spots can become contaminated with unsafe levels of organisms such as E.
Analysis
Introducing new insights on carbon emissions at a local level

Analysis
Introducing new insights on carbon emissions at a local level
Infometrics has recently added a number of environmental indicators to the Regional Economic Profile and Quarterly Economic Monitor, including estimates of carbon emissions. This article explores how we have constructed our estimates, and what insights can be gained from our analysis.
Analysis
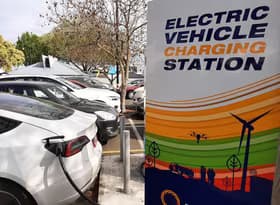
Do green districts buy more EVs?
Analysis
Do green districts buy more EVs?
Electric vehicle (EV) uptake in New Zealand has been accelerating over the last few years. Uptake was helped along with financial incentives including the Clean Car Discount scheme and the exemption of EVs from paying road user charges (RUC). With the discount scheme gone and EV owners about to start paying RUC, the trajectory is likely to change.
Chart of the month
A thirst-trap of drinking water quality

Chart of the month
A thirst-trap of drinking water quality
Drinking water quality remains a critical metric from which we can measure wellbeing in New Zealand. Access to safe drinking water is taken as given across almost all of New Zealand – for good reason. But as our Chart of the Month shows, although drinking water across most of New Zealand meets required standards, a lack of funding and measurement against some standards increases drinking water risks more than most would expect.
Analysis
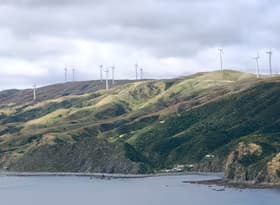
Emissions intensity across New Zealand’s industries
Analysis
Emissions intensity across New Zealand’s industries
New Zealand’s greenhouse gas reduction targets are a critical part of moving towards a more resilient and sustainable model of production. An important, and underdiscussed part of this conversation, is the notion of emissions intensity: the level of emissions in relation to GDP.
Analysis
The carbon dividend and pricing agricultural emissions
Analysis
The carbon dividend and pricing agricultural emissions
In this article we look at how a price on agricultural emissions that is lower than that paid elsewhere in the economy imposes a cost on New Zealand citizens that could reach an average of $1,000 per person by 2030.
Chart of the month
Masterton jumps up the wellbeing rankings

Chart of the month
Masterton jumps up the wellbeing rankings
Over the past six years Masterton’s wellbeing has improved its relative position in six out of nine wellbeing domains. In our chart of the month, we showcase the district’s movement up the wellbeing rankings using the Infometrics regional wellbeing framework available in the newly refreshed Regional Economic Profile.
Announcements
New wellbeing data boosts the refreshed Regional Economic Profile
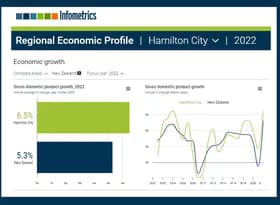
Announcements
New wellbeing data boosts the refreshed Regional Economic Profile
Infometrics is proud to announce that the Regional Economic Profile (REP) has been refreshed with a new look, improved functionality, new wellbeing data, and many new charts and tables. The REP provides in-depth economic insights into every region and territorial authority in New Zealand.