Articles
507 articles found for
Chart of the month
A more frequent state of emergency
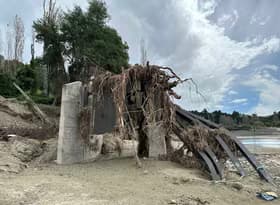
Chart of the month
A more frequent state of emergency
Resilience continues to be an important long-term factor for the New Zealand economy, and our Chart of the Month highlights the continued emergency challenges we face over time.
Analysis
Some recent economic development trends

Analysis
Some recent economic development trends
Infometrics was proud to sponsor the recent Economic Development New Zealand (EDNZ) 2025 Annual Conference, with a focus on “Local Strength, Global Reach”. As part of the conference, we shared an economic update and some analysis of key trends that the Infometrics team has noticed emerging as influential focus areas for economic development over the last year.
Media release
Economic turnaround beginning for most regions

Media release
Economic turnaround beginning for most regions
Economic recovery is getting underway across most of New Zealand’s regions, according to Infometrics’ latest monitoring of regional economies.
Analysis
Population slowdown everywhere in 2025

Analysis
Population slowdown everywhere in 2025
Stats NZ released their latest subnational population estimates this week, providing us with an annual reading of how population growth has affected each corner of the country. In this article, we explore the high-level themes for population growth in 2025, before diving into specific cities or districts to illustrate the trends we’re seeing.
Analysis
The economic contribution of ethnic communities

Analysis
The economic contribution of ethnic communities
New Zealand is an increasingly multicultural society. Here we look at the different ways that ethnic communities contribute to our economy.
Analysis
How New Zealand powers itself
Analysis
How New Zealand powers itself
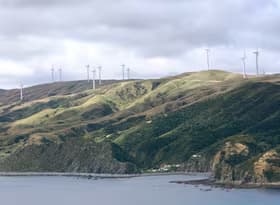
Energy is fundamental to economic growth and living standards. Here we look at how well New Zealand’s energy sector has been able to balance security, equity and sustainability, and the challenges it will face balancing them in the future.
Chart of the month
Demand not so hot for rare NZ stamp

Chart of the month
Demand not so hot for rare NZ stamp
New Zealand’s rarest stamp, the upside-down Lake Taupō, has changed hands again, but its modest long-term return highlights how investment performance can vary widely. As our Chart of the Month shows, some assets have delivered far stronger growth over the same period, even after accounting for inflation.
Analysis
New Zealand’s most creative city in 2024

Analysis
New Zealand’s most creative city in 2024
The 2024 Infometrics Creativity Index shows a further unbeaten trend for the top spot, although the prominence of job opportunities in the creative sector has declined slightly in 2024 for some areas.
Chart of the month
How warm are our houses?

Chart of the month
How warm are our houses?
A few cold days in recent months prompted a question around what the usual temperature of a New Zealand home actually was, and if there was any data to use to answer this question. In short, how warm is the average home? Turns out the answer is 21.4°C.
Analysis
How achievable is the Government’s international student target?

Analysis
How achievable is the Government’s international student target?
The recovery in international student enrolments is well underway. Here we unpack the uneven recovery to date and assess the likelihood of the Government’s target being met.